WEEK THREE


Summary of the week
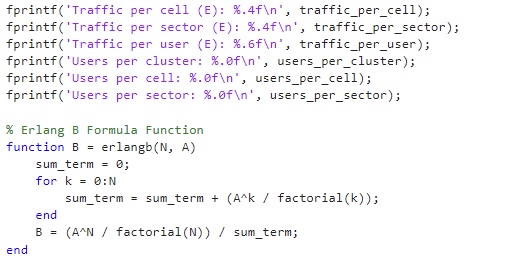
In the third week of our project, we made critical modifications to our code, focusing primarily on traffic calculations and user count estimation. Initially, we used multiplication in these calculations, but after reviewing our approach, we realized that this method was not only prone to confusion but also differed from the channel calculation approach.
To improve the clarity of our code and ensure consistency with the channel estimation method, we decided to switch to division. This adjustment not only enhanced the accuracy of our calculations but also made the overall code structure more intuitive and easier to understand. As a result, we updated the relevant equations to ensure a more accurate representation of network traffic distribution and user load.
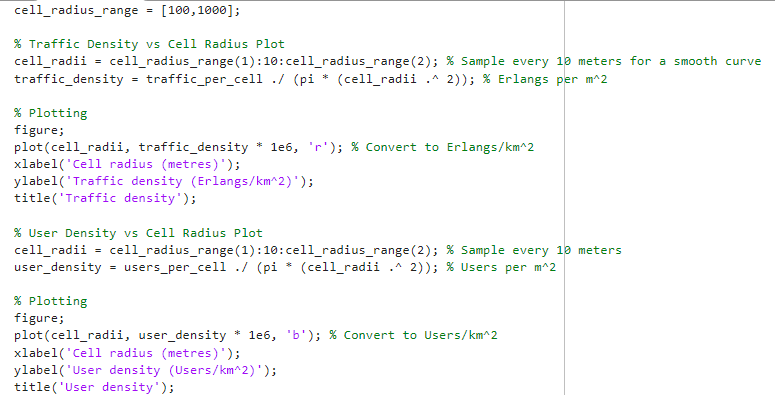

Additionally, we introduced a new input parameter: cell radius range, which plays a key role in our graph generation. By incorporating this input, we could analyze how network performance varies with different cell sizes, providing deeper insights into capacity planning. Implementing this change involved adjusting our data processing and visualization logic to ensure that the graphs accurately reflected the updated calculations.
After extensive testing and debugging, we successfully refined our models, making the traffic and user count calculations more consistent with channel estimation and generating clearer, more informative visualizations of network capacity.


Also, this week we finished the design of the matlab GUIDE.

Methodology
In addition to numerical calculations, our MATLAB program generates two important graphs.
1. Traffic Density vs. Cell Radius
1. Traffic Density vs. Cell Radius

This graph shows how traffic load per square kilometer changes with cell radius.
2. User Density vs. Cell Radius

This graph shows how user density varies with cell radius.
Analysis of Graphs:
•Smaller cell radius → Higher traffic density and user density (suitable for urban high-demand areas).
•Larger cell radius → Lower density (suitable for rural or low-traffic areas).
These visualizations allow engineers to analyze the trade-offs between cell radius and network performance.
Problems
How to combine the calculation code and the MATLAB GUIDE code.


Comments
Post a Comment